MY
ACHIEVEMENTS

Types of projects
Here is a list summarising the different types of projects carried out.
Open data
The aim was to make dashboards and find insights using the Open Food Facts database.
Data analyse
The problem was to carry out a market study of the water sector for a banking institution using databases (NAF codes, billing data, DIANE database, etc.)
Data segmentation
Build an RFM (Recency, Frequency, Monetary) segmentation for the company Esprit Equitation using the customer database extracted from the CRM.
Automation week
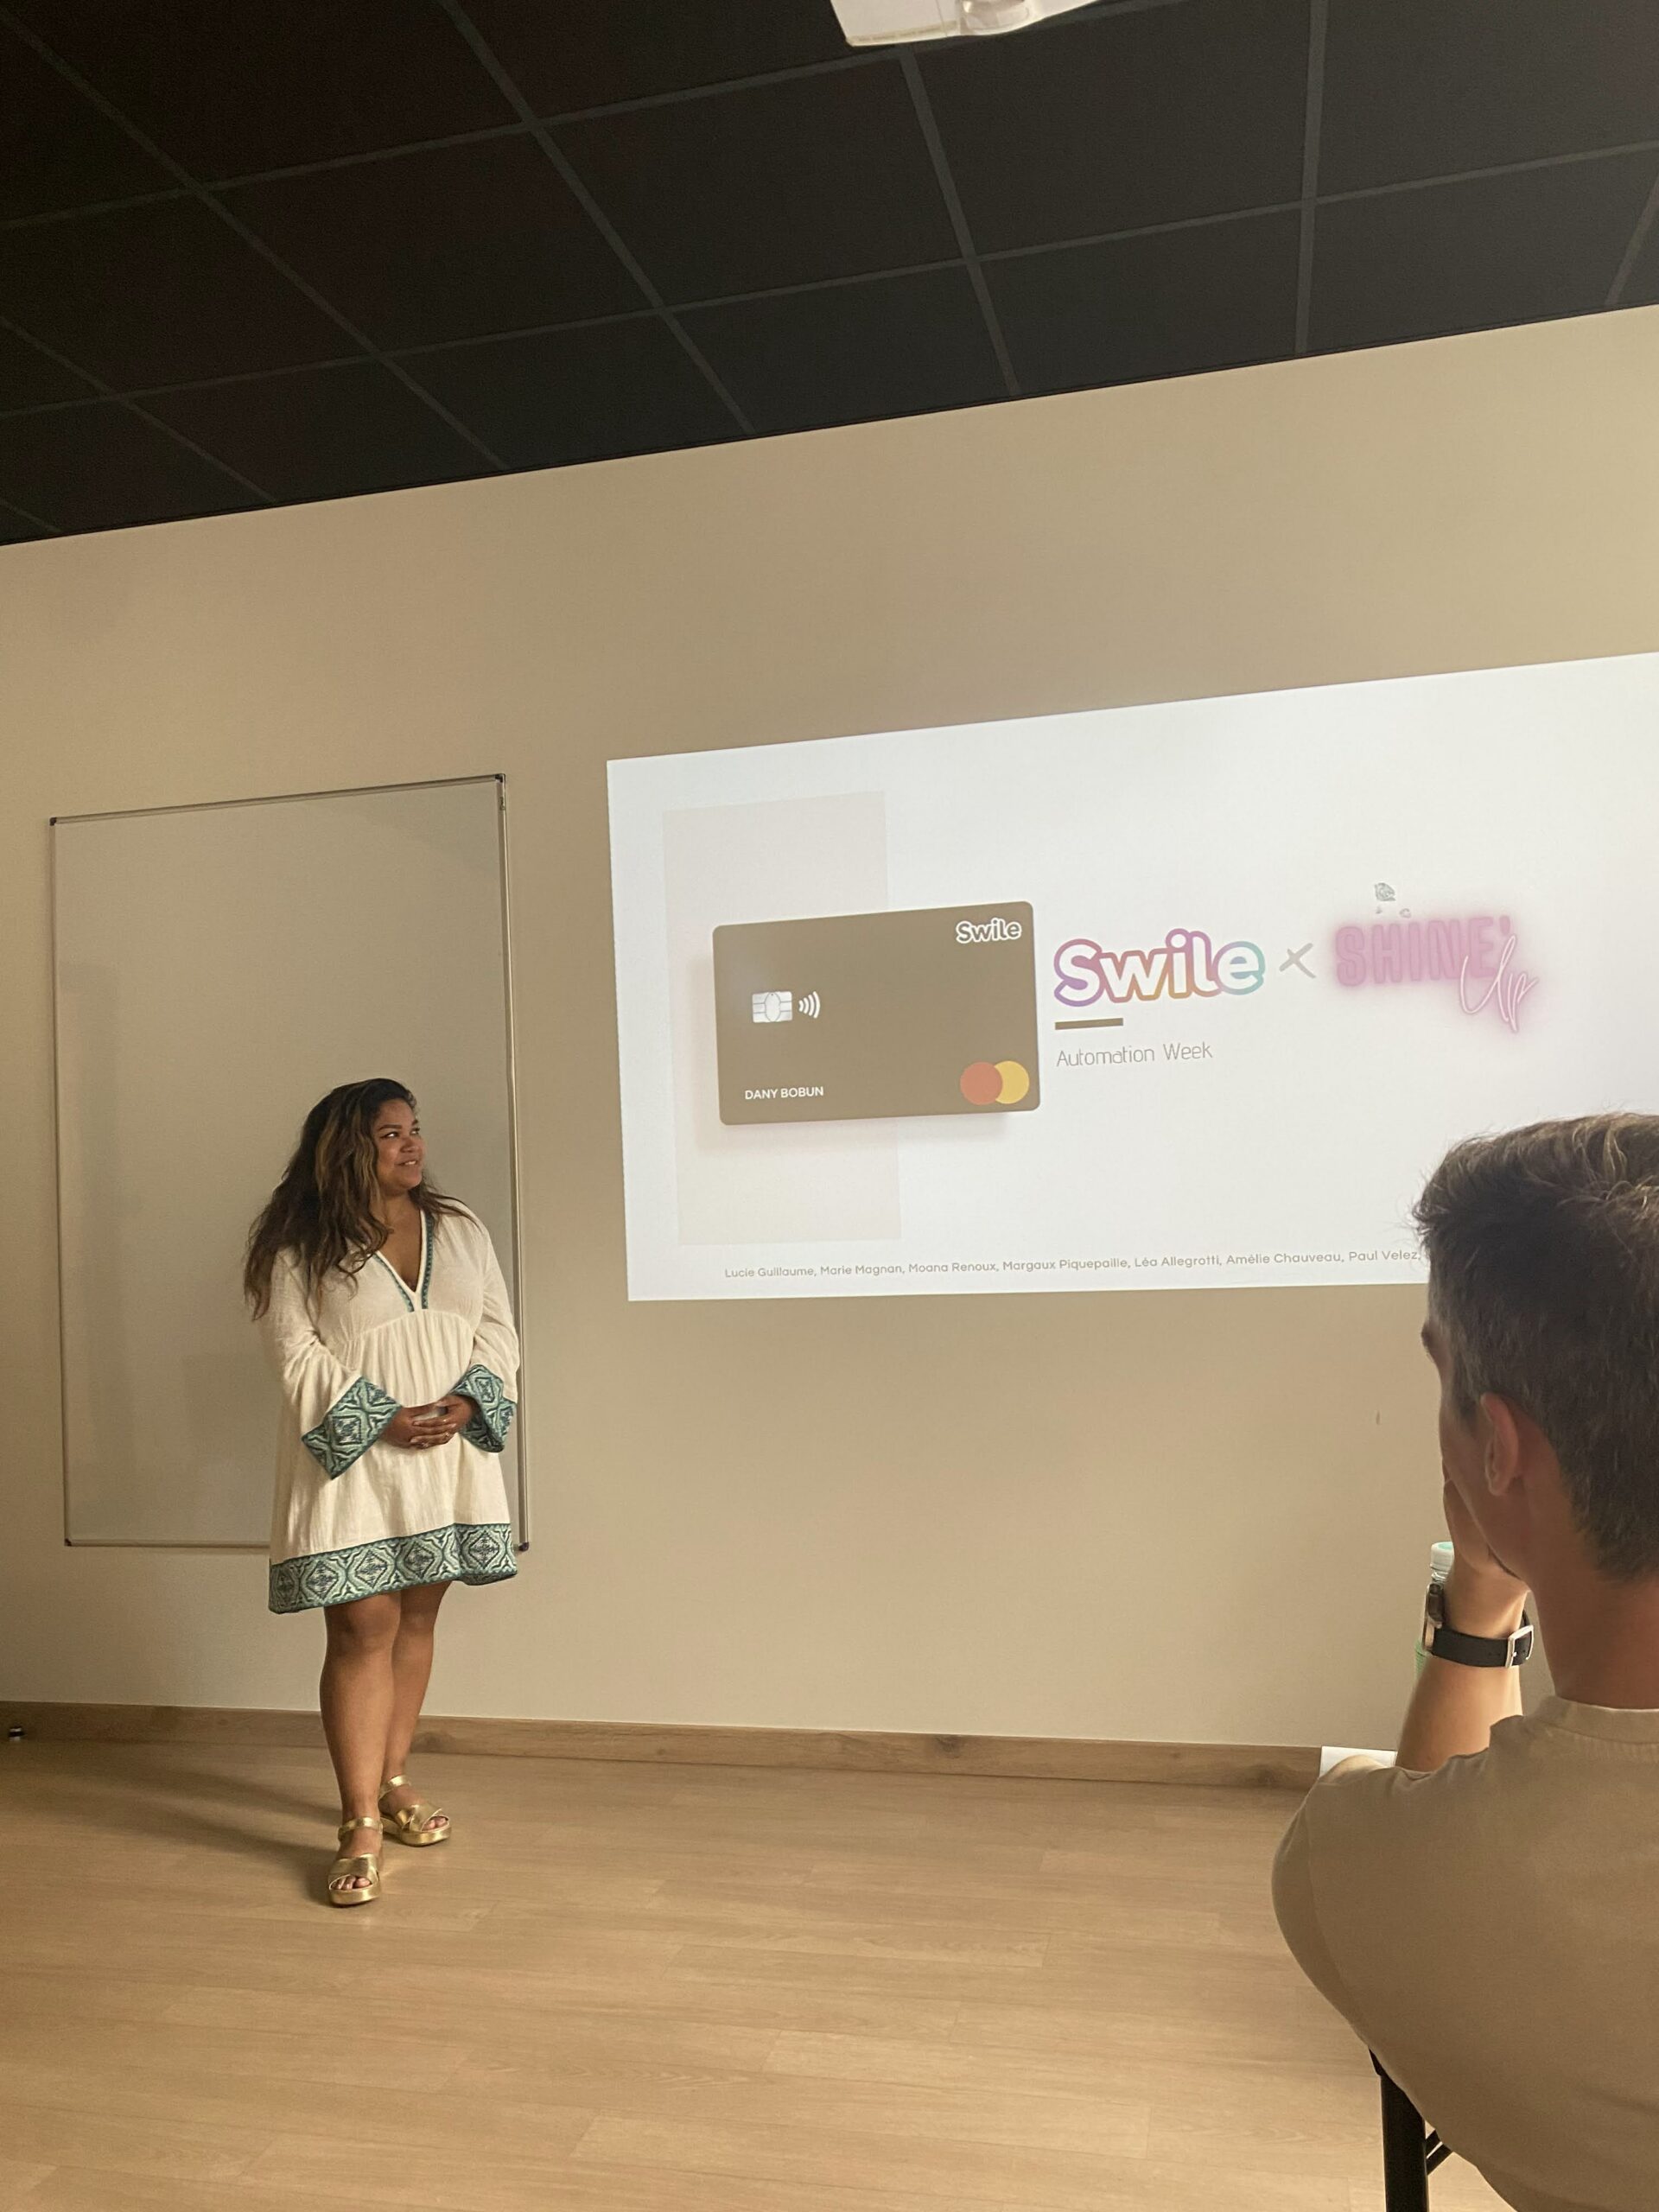
For the company Swile, we devised a new acquisition system.
The system integrates an automated e-mail process via HubSpot as well as various marketing actions.
Digital transformation
For the company Lothaire, we proposed a new management of digital tools with a view to satisfying the customer online and in shop with the implementation of a new CRM and a new data flow architecture.
Data consulting
For the company Agon, we designed an automated dashboard on Google Data Studio fed by external data (API) and data from our database modeling on SQL.
CERTIFICATIONS & TOOLS
Technical User Certification

Protection of personal Data Certification

Practice of the tool and validation of the endpoints of the certification.

Overall mastery of the tool and certain connectors: SQL, Sheet, AT Internet.
OPEN DATA
The goal of this project was to use an open data base : OpenFoodFacts (a famous data base given nutritional informations like calories, nutri-score, grams of sugar, etc. about many products).
My groupe and I, have decided to use this data base within a mobile app. This application allow you to plan your different meals during the week. The different products consumed during the meal will be indicated and a global summary per product and per meal consumed will be given.
You will therefore have personalised dashboards according to your dietary needs and your schedule.
DATA VISUALISATION
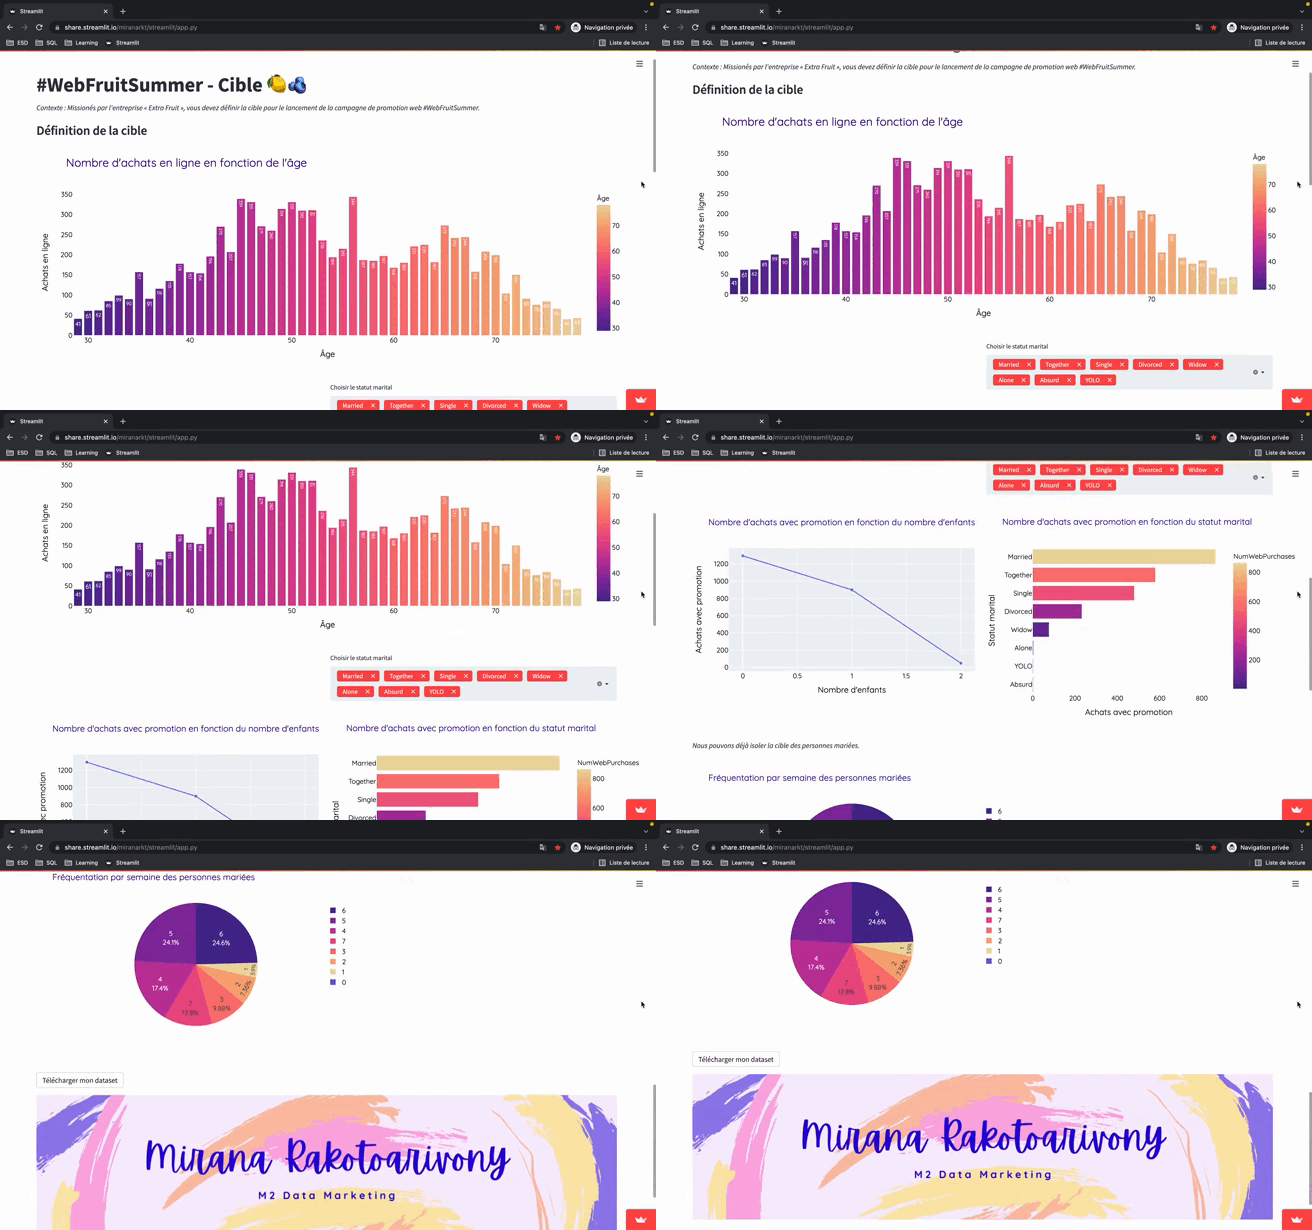
You will find here an example of a dashboard entirely coded in Python that I made using Streamlit.
It represents, in a fictitious way, a dashboard on the consumption trends of fruits in French households within the framework of a marketing campaign launch.
This project allowed me to do data analysis with Pandas and to visualise this data with Plotly.
You can find the link to the Streamlit on my GitHub as well as the code, and a PowerPoint explaining the project briefly.
OTHER PROJECTS
THEY TRUSTED ME…
